
I like using AI to improve the team’s work. I also need to follow what happens next: growing review queues, feedback that loses context, and difficulty explaining what was delivered.
A Monday you might recognize
Leadership asks for more speed. The team has opened more PRs. A reviewer spends the morning trying to understand a large change. In a 1:1, someone says they are delivering more, but can no longer explain everything they put into production.
This is an illustrative scene. It brings together challenges found in the collected material: review costs, pressure to show activity, lost context in feedback, insufficient learning and unclear accountability. Those accounts help frame questions; their percentages and composite quotes are not treated here as verified research.
I would start by talking with the team to understand these difficulties. When someone says “AI is helping,” I want to know which task, what improved, and who can investigate the solution when it fails.
The 2025 DORA report describes AI as an amplifier of organizational strengths and weaknesses. That makes it essential to look at the process the tool has entered.
When the tool takes the place of judgment
| Management choice | Possible failure | The missing conversation |
|---|---|---|
| Reward prompts, commits or generated code | More activity, review queues and invisible rework. | Did the customer get something better? What did validation cost? |
| Deliver AI-written feedback without checking it | Generalizations, lost context and invented facts. | Which concrete situation supports this feedback? How did the person experience it? |
| Treat automated approval as a guarantee | Business rule and security risks without an owner. | Who checked the failure hypothesis and can explain the decision? |
| Automate and record every conversation | Unnecessary exposure and less room for doubts. | What is worth recording? What do participants want to share? |
| Demand answers about red signals before investigating | An alert becomes blame; a collection failure becomes a diagnosis. | Are the data complete? Which blocker can the manager remove? |
These are failure modes to investigate in your context, without assuming they occur in every team. Simon Willison argues that delivery should include evidence that the code works and human accountability. Peer review should start from that commitment.
What the gauges show
The fields contain published findings where a related reference was available. They include average test scores, average self-reported productivity gains and shares of survey responses. Each panel identifies its measure, source, population and limitations.
These numbers are not human-centered process scores. There is no validated average for the four specific criteria defined for each practice. They appear under “Local control,” marked as requiring local evidence. N/A means no comparable average was found in this review, not zero.
We do not average across studies: questions, methods and populations differ. The gauge showing two averages (50% / 67%) has no single fill, because that would hide the comparison.
AI helps when people help shape the process
The proposals below combine current references with the challenges in the collected material. Ethan Mollick proposes bringing leadership, experimentation and the people doing the work closer together. That is a useful starting point for a pilot.
Understand the work before asking for speed
A manager receives an AI adoption target. The team is dealing with aging integrations, poorly documented rules and a growing review queue. Before asking for more speed, I would look at where work is waiting and what is worth accelerating.
How to lead this. I would choose a user journey with Product and the people who operate it. Then we would agree on the expected outcome, risks and who follows the pilot. When comparing tasks, I would include review time as well.
Tools that help. Plugin: a proposed internal engineering management package. Skill: a proposed workflow diagnosis procedure. Connectors: Jira or Linear, approved documentation and service metrics. A plugin is optional; reliable sources and accountable owners are essential.
Control indicators. Customer outcome, time from idea to value, and total review and correction effort.
Claude prompt: Understand the work before asking for speed
Read [objective, backlog and baseline]. Identify where work waits and which decisions lack an owner. Separate evidence from hypotheses. Before proposing automation, ask three questions for Product and the team. Suggest a reversible pilot. Do not change targets or send messages.
External reference for this topic
This result is not a human-centered process score.Anthropic’s internal survey: a reported productivity gain, not an audited pilot outcome.
Limit. This does not establish team participation, Product acceptance or benefits in your team.
Local control: four criteria without a published average
- The team helped select the problem Local evidence required; no comparable published average.
- Product validated the expected outcome Local evidence required; no comparable published average.
- Boundaries and an owner were agreed Local evidence required; no comparable published average.
- The pilot was reviewed with the people doing the work Local evidence required; no comparable published average.
People using AI need to explain what they deliver
Someone finishes a task early but struggles to explain the business rule or investigate a failure. I would bring that into the conversation: what did they understand about the solution, and where do they need support?
How to lead this. Combine AI assistance with an explanation of the solution, tests and pairing. An investigation can start with the person’s own hypotheses before they ask the tool. The challenge should fit their stage of development.
Tools that help. Plugin: Code Review in Claude Code as a second pass. Skill: a proposed explanation and test planning procedure. Connectors: GitHub/GitLab and CI/CD. Mentoring and a test environment remain necessary.
Control indicators. Review wait time and recurring service rework; qualitative evidence of independence in the individual development plan.
Claude prompt: People using AI need to explain what they deliver
Using [diff and tests], help the author understand the solution. First ask about the rule, alternatives and failure cases. Then compare their answers with the code and identify gaps. Do not assess the person. Create a small investigation exercise with verification criteria.
External reference for this topic
This result is not a human-centered process score.An experiment learning the Python Trio library. The difference in quiz scores was 17 percentage points.
Limit. These are not professional performance ratings or a general average for learning with AI. The time saving was not statistically significant.
Local control: four criteria without a published average
- The author explained the decision in their own words Local evidence required; no comparable published average.
- The author demonstrated a test and a failure case Local evidence required; no comparable published average.
- The reviewer discussed an alternative Local evidence required; no comparable published average.
- A learning exercise was agreed Local evidence required; no comparable published average.
Feedback needs context
An automated summary can look flawless and still miss what matters: someone who managed a dependency, helped a colleague or stopped disagreeing to avoid unwanted attention.
How to lead this. I would prepare feedback around a concrete situation and listen to how the person experienced it. If context is missing, we need to adjust the record. AI can help organize the notes both participants have chosen to share.
Tools that help. Plugin: none required for a 1:1. Skill: a proposed agenda and development agreements procedure. Connectors: calendar and a private notes folder, both optional. Manually supplied, authorized notes are sufficient.
Control indicators. Agreements reviewed on time and blockers addressed; no automated performance rating.
Claude prompt: Feedback needs context
Use only [authorized notes and previous agreements]. Suggest open questions about blockers, learning and support. Do not infer intent or feelings. Preserve differing views. After the conversation, organize only explicit agreements into action, owner, deadline and review date, for both participants to validate.
External reference for this topic
This result is not a human-centered process score.Agent users who agreed that agents improved collaboration within their team.
Limit. This is a share of responses, not an average of 1:1 quality. It does not measure listening, privacy or agreement validation.
Local control: four criteria without a published average
- The person chose what to share Local evidence required; no comparable published average.
- The manager listened and recorded context Local evidence required; no comparable published average.
- Both participants validated the agreements Local evidence required; no comparable published average.
- The manager’s support has an action and deadline Local evidence required; no comparable published average.
Managers need to care for the queue and the decisions
When generation accelerates, I want to understand with the team where validation has become concentrated. The manager agrees delivery criteria, protects review time and follows up on decisions about deviations. Tech Leads, domain experts and SRE need to know which decisions they own.
Code review starts before the PR is opened
When AI produces a large change, the cost may land in the reviewer’s calendar. The person opening the PR needs to provide evidence that the solution works so their colleague can make a useful review.
How to lead this. My recommendation is to agree on small PRs, explicit intent, test evidence and a rollback plan. This gives the reviewer a basis to discuss business rules, risk and maintainability. AI findings need confirmation before they become fixes or public comments.
Tools that help. Plugin: Code Review, verified in the Claude Code catalog. Skill: a proposed risk-based review procedure. Connectors: GitHub MCP or GitLab API, CI/CD and requirements. The plugin can publish comments; enable writing only with a defined scope and workflow.
Control indicators. p75 review wait time, rework and change failures; interpret volume and criticality.
Claude prompt: Code review starts before the PR is opened
Review [diff], [requirements] and [tests]. For each finding, cite file and line, failure condition, impact and reproduction steps. Distinguish confirmed bugs from hypotheses. Identify questions for the author. Do not approve, merge or publish comments. Return a review for human validation.
External reference for this topic
This result is not a human-centered process score.Respondents who cited this problem when using AI tools.
Limit. This is not a bug rate or the share of defective PRs. It supports attention to verification, not compliance with local criteria.
Local control: four criteria without a published average
- The author supplied intent and tests Local evidence required; no comparable published average.
- The reviewer confirmed relevant findings Local evidence required; no comparable published average.
- The accountable owner validated risks and rollback Local evidence required; no comparable published average.
- The author understood the correction Local evidence required; no comparable published average.
Passing tests should explain what was protected
When the same AI writes the code and tests, I would check which rules were actually verified. A failure could cost a customer money or repeat an operation even when the tests pass.
How to lead this. Derive tests from requirements and risk. For payments and events, include duplication, idempotency, partial failure and recovery where relevant. Gates block delivery when a required check fails.
Tools that help. Tool: Playwright MCP for UI testing in an authorized environment, where a UI exists. Skill: a proposed testing strategy and deployment readiness procedure. Connectors: CI/CD, requirements and security results. Playwright does not replace contract, integration or financial rule tests.
Control indicators. Escaped defects, change failures, deployment rework and failed deployment recovery time.
Claude prompt: Passing tests should explain what was protected
Read [rules, architecture and existing cases]. Identify missing critical scenarios, including failures and recovery. Propose tests independent of the implementation, acceptance criteria and evidence required for deployment. Do not claim a test passed without recorded execution. Do not run in production.
External reference for this topic
This result is not a human-centered process score.Respondents who reported distrust in the accuracy of AI outputs in their development workflow.
Limit. This does not measure code security, test effectiveness or failure rate.
Local control: four criteria without a published average
- The domain owner validated critical scenarios Local evidence required; no comparable published average.
- Test execution evidence is available Local evidence required; no comparable published average.
- The reviewer checked the limits of the tests Local evidence required; no comparable published average.
- Exceptions have a justification and owner Local evidence required; no comparable published average.
An alert should start an investigation
The dashboard turns red. Before demanding an answer, I would look with the team at what changed: a deployment, demand, or even the integration collecting the data.
How to lead this. Operational failures and trends need different responses. Rules should be deterministic, data should be reconciled, and each route needs an owner. Claude can summarize evidence and open questions. In the weekly meeting, I would agree with the team on one blocker we can remove.
Tools that help. Plugin: a proposed internal monitoring package. Skills: proposed incident triage and DORA analysis procedures. Connectors: Grafana/Datadog, PagerDuty, CI/CD and a Slack/Teams channel. A scheduler, storage and a rules engine complete the operational setup.
Control indicators. SLO, the five DORA metrics, data freshness and alerts that led to useful action.
Claude prompt: An alert should start an investigation
Use [calculated snapshot and policy]. Check freshness and completeness. Summarize only triggered alerts, with service, rule, n/N, source, impact and owner. List alternative hypotheses and the next verification step. Do not assign blame, create incidents or send messages. Recommend an action the manager can take to remove a blocker.
External reference for this topic
This result is not a human-centered process score.DORA 2025 respondents reporting little or no trust in AI-generated code.
Limit. This is not alert frequency or a failure rate. Its question and population differ from Stack Overflow’s.
Local control: four criteria without a published average
- The alert has evidence and an owner Local evidence required; no comparable published average.
- The team helped analyze the context Local evidence required; no comparable published average.
- The action addresses an identified blocker Local evidence required; no comparable published average.
- The outcome was reviewed with the team Local evidence required; no comparable published average.
| Signal | Proposed condition | Owner and first action |
|---|---|---|
| Collection unavailable | More than 2 hours without success in an hourly collection. | The data owner checks the integration; the dashboard shows insufficient data. |
| Validation queue | p75 review wait > 1.3× baseline for two weeks; n ≥ 20 eligible PRs. | The Tech Lead checks change size, capacity and dependencies. |
| Change failures | Rate > baseline + 5 percentage points; ≥ 20 deployments in 28 days. | SRE/EM investigate causes; critical incidents follow the on-call process. |
| Required quality check | A required test or security gate failed. | The author and reviewer address the block before delivery. |
These are proposed limits, not industry benchmarks. Adjust them to the baseline; a zero baseline requires an absolute threshold. Each alert includes its rule, service, window, source, sample and owner. Notify on opening, severity changes and resolution, avoiding duplicates.
- Reliable data
- Verification
- Human decision
- Action with owner
- Review
KPIs worth bringing into the conversation
| Management question | Indicator | How to interpret it |
|---|---|---|
| Did the work improve something for the customer? | Conversion, journey completion or resolution time. | Choose an outcome and segment per service with Product. |
| What does delivering that outcome cost? | Cost per successful outcome and total pilot cost. | Include licenses, infrastructure, review and correction. |
| Are we delivering reliably? | The five DORA metrics and SLO. | Compare the same service; show window, n/N and completeness. |
| Where is work waiting? | p75 review wait and blocked items. | Discuss capacity, dependencies and change size. |
| Are people becoming more independent? | Evidence of practice and reviewed development agreements. | A private, contextual conversation, without individual scoring. |
The five current DORA metrics are deployment frequency, change lead time, failed deployment recovery time, change fail rate and deployment rework rate. Lead time starts at the commit; time from idea to value is a separate indicator.
What to install, teach and connect
A prompt guides the current task. A skill teaches a reusable procedure with criteria and examples. A connector provides access to a source or action. A plugin bundles capabilities for a job. Configuration varies across Claude, Cowork and Claude Code; check the product surface, plan and permissions.
Code Review is an existing Claude Code plugin. The diagnosis, learning, 1:1 and triage skills described above are proposals for this method; they are not installed. Version and evaluate them before use. The Agent Skills guide explains the mechanism.
Start with pilot repositories, CI/CD, backlog and selected documentation. Add observability, incidents and costs when the use case requires them. Continuous alerts need a collector, storage, rules and a notification destination. For 1:1s, keep authorized notes under separate access. The connector documentation helps verify available capabilities.
A first monitoring cycle
I would start with one service and the people who deliver, review and operate it. The four-week baseline can use validated historical data; without it, we need to extend collection. During the pilot, I would keep alerts in observation mode and agree on evidence-based review and one learning exercise per participant. The proposed cadence is weekly for flow, every two weeks for 1:1 agreements, and monthly for value and cost.
At 90 days, decide with the team whether to expand, adjust or stop. METR’s 2026 update highlights the difficulty of measuring AI’s current productivity effect. Local comparisons also need to disclose limitations and avoid treating a simple before/after comparison as causal evidence.
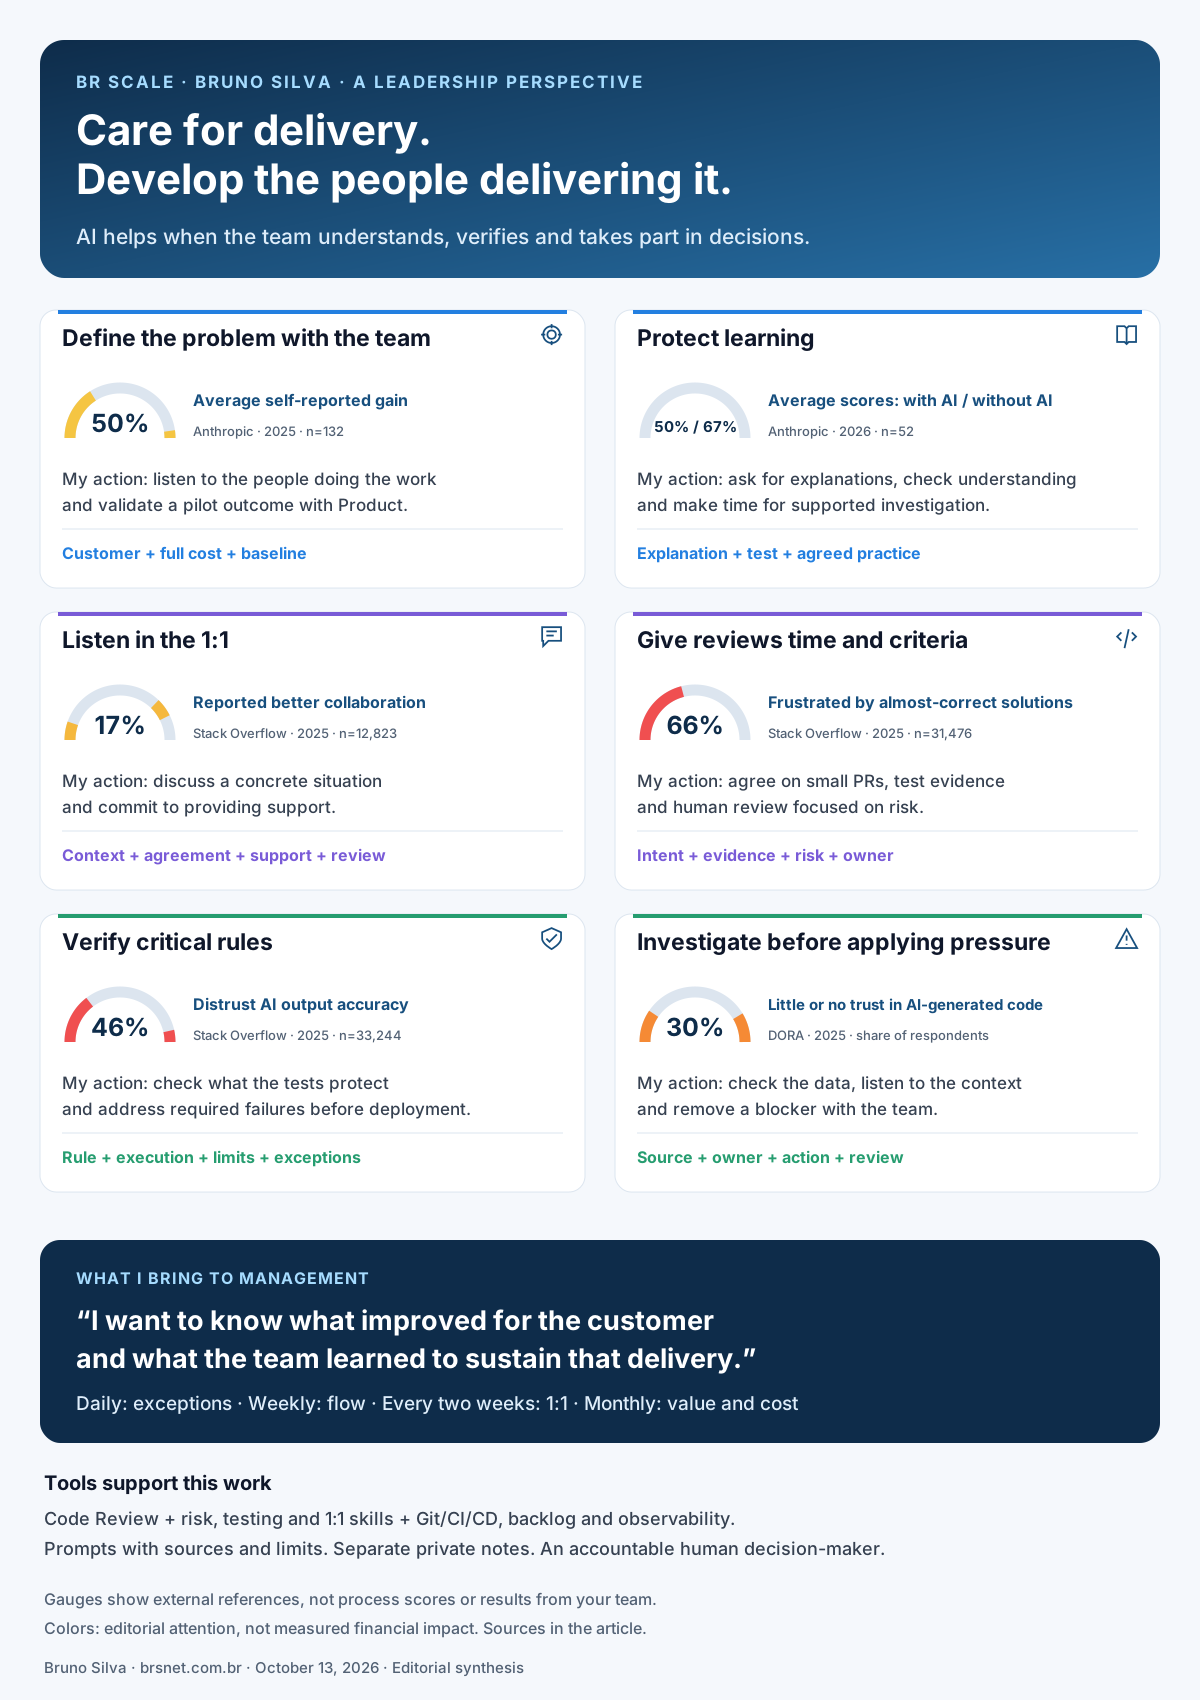
Summary infographic
I want better delivery and a team that can sustain it
When I look at AI use in a team, I want to understand what has changed in the work. I want to know whether the person can explain the solution, whether the reviewer has time to check risks, and whether the customer got something better. That conversation helps us understand where the tool contributes and what we need to adjust.
In a 1:1, I would bring a concrete case, a question that went unsupported and a skill the person wants to develop. I would also commit to an action: remove a dependency, offer mentoring or reserve practice time. That development needs time in the calendar and follow-up at the next meeting.
To track delivery, I would combine customer outcomes, full cost, reliability and the five DORA metrics. I would use alerts to start an investigation with the team. In code review, I would ask for intent, test evidence and an understanding of the correction. Plugins, skills and connectors help organize this work; people need shared criteria and clear responsibility.
The commitment I make
I want to know what improved for the customer and what the team learned to sustain that delivery. If speed increased, I also need to check what happened to review, cost and people’s ability to work independently.